
How Google Responds To Blogging Breaks & Subsequent Publishing
If you’ve wondered how search engines respond to breaks and the activity following them, my unique data below points to Google sending traffic to websites with active blogging and they reward websites who become active following a break. Let's dive in.
Since I began blogging in 2014, I’ve taken a break from blogging at the end of each year providing an interesting and unique set of data for evaluating Google’s response to both my inactivity and the subsequent reengagement.
To shed some light on these patterns, I went back through my blog to find as many sample data sets as possible. My criteria had me identify all blogging breaks at least a month in length. Outside of my annual breaks, I was able to find two more lapses in my blogging activity.
To illuminate answers, I’ve pulled together graphs below of these windows of inactivity sandwiched by the two months prior and the two months following. While each one shows different parts of the roller coaster, there are two prominent trends in the data. Let's start by looking at my first blogging break since I began in January 2014.
Break 1 - November 27th, 2014 - January 16, 2015
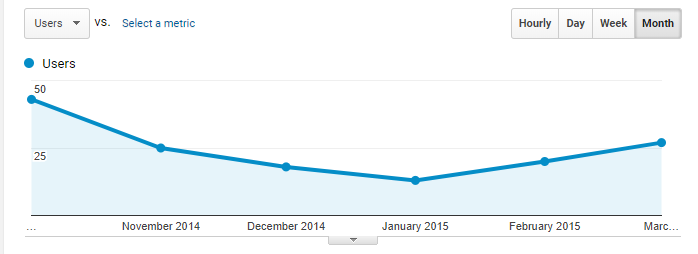
Chart Date: Oct 1, 2014 - Mar 31, 2015 | 143 Users
This first graph shows a decline in organic traffic in December and January during the break and the first part of me picking it back up. The increase in organic visitors comes in the February and March of 2015. The volume of search visitors for the window is the smallest sample size of the bunch, but it does seem to indicate that Google sent less traffic while I was paused, and increased it shortly after my break.
Break 2 & 3 - October 19th, 2015 - December 7th, 2015 & December 9th, 2015 - January 3rd, 2016
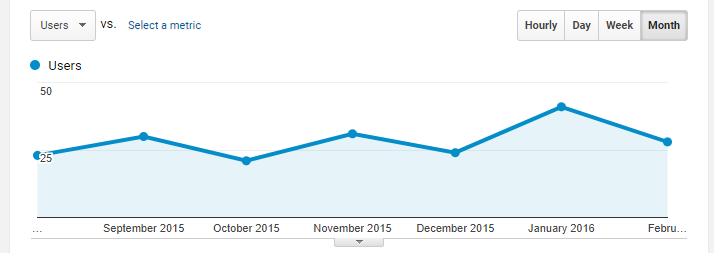
Chart Date: Aug 1, 2015 - Feb 29, 2016 | 192 Users
When we look at this seven-month span, we see the two weakest months are my inactive ones. Both subsequent months after I resumed came back stronger than the prior month. This again illustrates that activity boosts performance while resuming activity rebounds strong.
Break 4 - June 28th, 2016 - July 31st, 2016
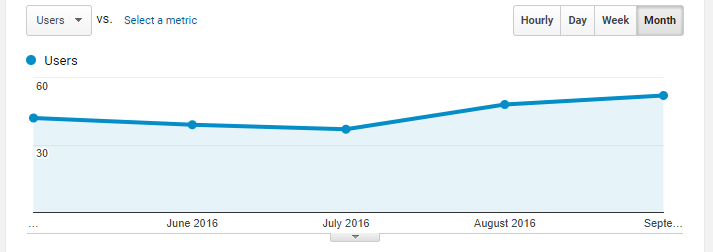
Chart Date: May 1, 2016 - Sep 30, 2016 | 212 Users
This is was an "accidental" break from my blogging journey and took place in the middle of the year, as opposed to the end. It didn't buck the trend. July was still the lowest searched generated month of the span. The following two months had another strong rebound as this trend continued.
Break 5 - December 3rd, 2016 - January 10th, 2017
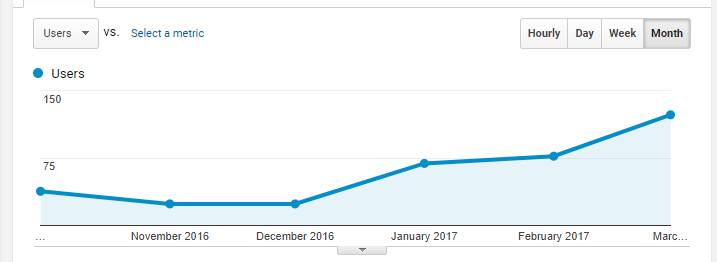
Chart Date: Oct 1, 2016 - Mar 31, 2017 | 347 Users
Now here is when searched traffic on my website began to escalate fairly dramatically, and it was not the result of an intentional effort. One primary cause was a blog post created ten months earlier getting ranked high for a commonly used search phrase.
While we see the bounce back went up dramatically for three months, we also see the month of pause was the weakest, again.
One difference between this and the first break at the end of 2014 was how quickly January turned around. I suspect a blog with a larger library of content gets more crawling activity, or it's explained by how Google has shifted more towards real-time ranking results.
Break 6 - December 1st, 2017 - January 1st, 2018
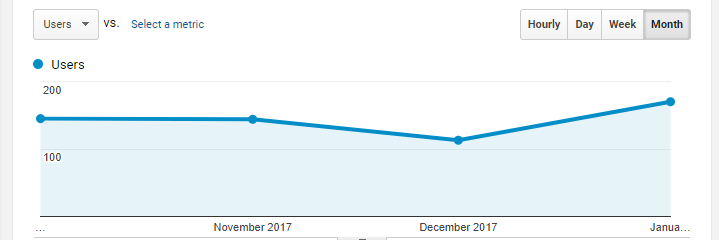
Chart Date: Oct 1, 2017 - Jan 31, 2018 | 561 Users
And here's the latest data set from my December 2017 blogging break. Again, there's a dip in organic traffic and a nice bounce back in January. Even only with four months in this graph, it's the largest sample size of search users across all graphs.
The one difference with this period of time compared to all the others was my increased blogging frequency. From August through November 2017, I was blogging every weekday producing a total of eighty-eight new articles. Since most of my blogging before was a handful of times per month, this was dramatically higher and more consistent.
But, it doesn't seem to have affected the two main trends observed in this data. When we're not blogging actively, Google sends fewer people our way.
Second, there seem to be clear benefits to reactivating a blog after a break. This benefit seems two-fold. First, there's a bounce back when we get back to the keyboard, and it seems the bounce back equalizes or exceeds the loss from the month of zero activity.
It also seems like this break may be triggering a larger boost in the many months that follow it. If this insight is correct, it's possible that taking an intentional break from blogging could actually lead to an increase in search engine traffic. It's hard to know what the traffic would have been without the break, so more data is likely needed to discover the accuracy of this claim.
While I've taken these annual blogging breaks to rest and release as a way of getting away from the process, rejuvenating, and incubating ideas for when I resume, it seems there may be a powerful long-term benefit to the Google traffic that follows.
Have you been blogging for a while? Do you have any data to contribute to this theory? If so, write up an article and send me a link. With additional insight, we'll be able to crack the code on how breaks affect Google rankings and traffic.
Photo by Michael Mroczek on Unsplash
Search Engine Optimization (SEO)
- Created on .
- Last updated on .